
Go Ahead, Punk, Slash My Revenues
Why Passing Cheap Wind and Solar Costs to Consumers Could Trigger a Financial Showdown for Generators Like Ørsted: "be careful what you wish for"

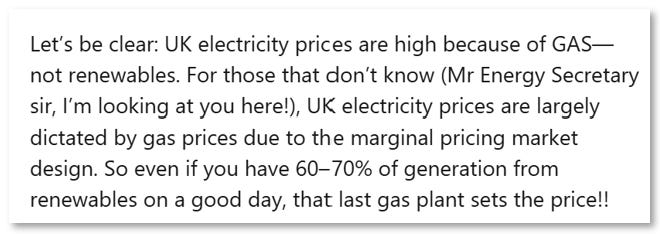
Repeat after me - “electricity prices are high, because gas prices are high.”
How so? In the electricty market pricing is dictated by the marginal price required to generate the “last electron”, with all providers getting paid that marginal price1 (more on this below).
To the great chagrin of many renewable advocates the low generation cost of wind and solar don’t come through in people’s electricity bills, but the high prices do. This leads to the following reasoning.

“We should simply pay for wind (cheap) when we use it and gas (expensive) when we use it.”
As painful as this is to write; I agree with Greg.
Indeed, I couldn’t agree more. This would be a wonderful exercise in business economics. BRING IT ON, oh please… let’s just try this once?

The TL:DR version of this is that it would undermine the economics of renewable energy companies overnight. To understand why, lets dig in.
Price and the Merit Order
Electricity is produced by a variety of means, as the demand curve gets filled up the market price paid is set by the generator who provides the last electrons. What is confusing for many is that all the providers get paid that clearing price. An overly simplistic, and somewhat misleading, representation of this is seen below - the provided context from Hannah Ritchies’ post is important:
Note that this is a very simplistic diagram of the electricity mix – in reality, there will be different prices within each box. The price of generating gas will vary by power plant due to factors such as age, efficiency, and technology type. Each box is more like a staircase, rather than a rectangle.
Here we’re focusing on wholesale or electricity generation costs, not final consumer costs which include other things such as transmission costs and taxes.
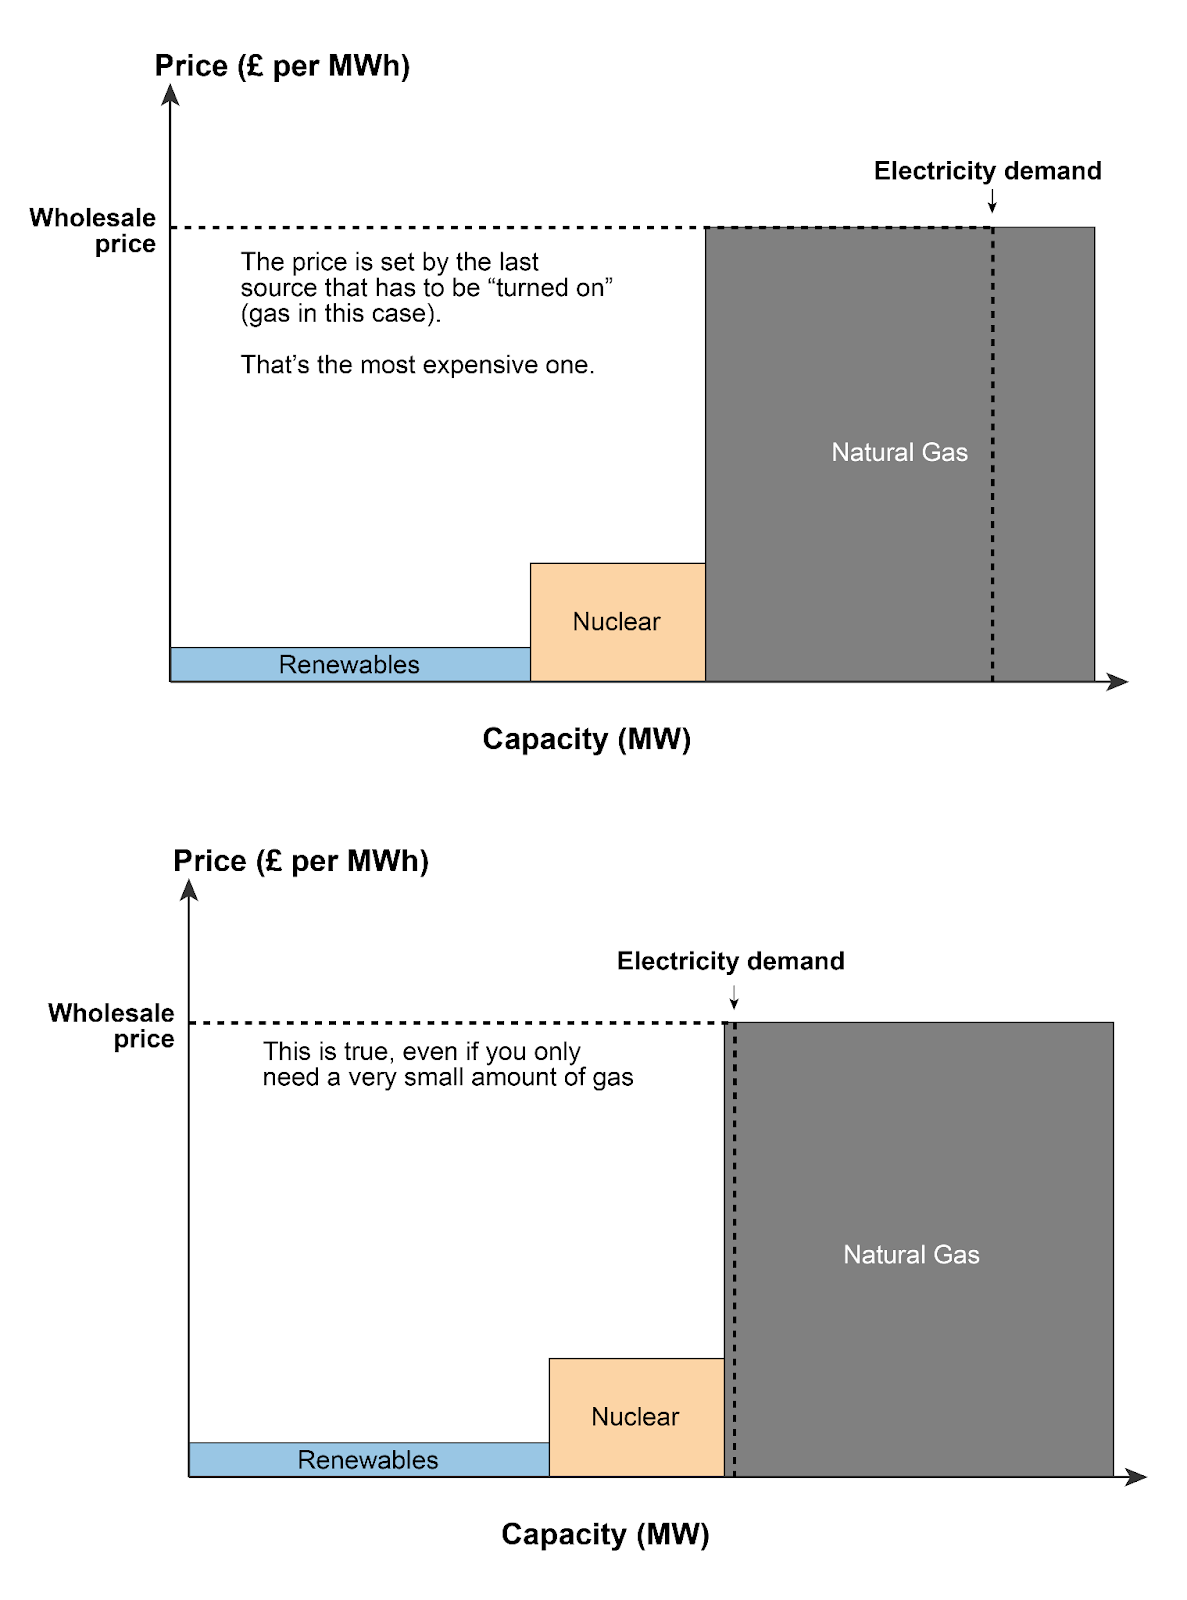
The image comes from the usually very sensible Hannah Ritchie “If the UK has lots of renewables, why do electricity prices follow gas prices?”, and a clear explanation of why these representations are misleading by at Eigen Values
The chart shows how if demand is slightly higher than what can be delivered by a combination of renewables and nuclear, then the wholesale price of electricity is driven by the marginal price of gas. If the price of gas-fired electricity is higher than the other sources, then gas will set the price of the market. So far, so good, however I have a few problems with this chart. First, the y-axis scale seems to try and reinforce the myth that renewables are nine times cheaper than gas. Second, it also seems to suggest that the price we pay for renewables is the marginal cost of production. Both notions are false… (Eigen Values)
Whilst such a pricing mechanism may seem odd, this is how most commodity pricing works. Oil producers get the global market clearing price - which has no direct relation to their cost of extraction. Likewise, coffee, cocoa and cotton.
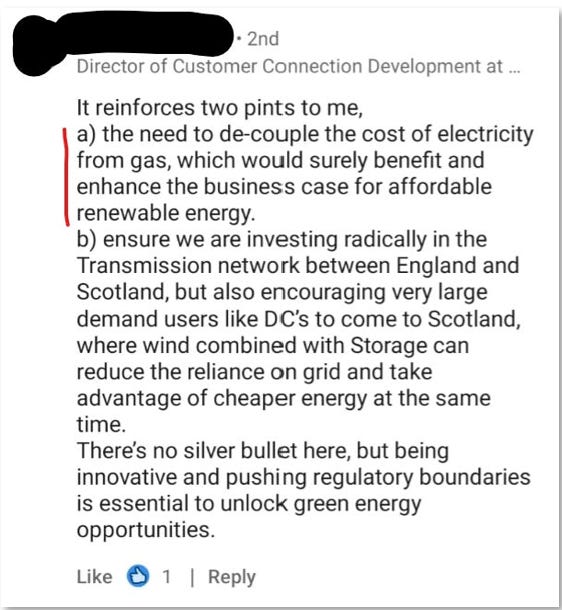
With respect to electricity, there are some entirely reasonable questions to be asked about this pricing mechanism - there are also some wild ones. Decoupling renewables-pricing from gas-generation pricing is as fashionable as it is wild.
Would That It Be So
As with the X post from Greg Jackson (CEO of Octopus Energy) at the top of this article, I recently came across a very articulate and earnest blog post (which of course I can’t find now)… in which a pro-renewables author was lamenting that customers were not reaping the benefits of the low cost of wind and solar because of the insidious effect of the price of electricity (usually) being set by the cost of gas-fired generation. This idea is now very widespread, herewith another example:
Indeed, this same idea is noted in Hannah Ritchie’s post - if demand could be met by renewables and nuclear - then that pesky gas pricing could be removed from the equation:

Of course, not all electricity is sold on the market a lot of gas and nuclear are contracted, and for renewables - Contracts for Difference (“CfDs”) provide a strike price - giving the seller a floor (a price they will always get, guaranteed by the tax-payer) whilst giving back (to the tax-payer) any upside when the market is above the strike. PPAs (essentially long term contracts with agreed pricing) also provide revenue certainty. An interesting (but separate) exercise would be to see how much electricty (for a company or indeed at the country level) is priced by the market and how much is priced by contracts, CfDs and PPAs.
In what may come as a huge shock to my readers - I’d like to express my support for the idea of payments based on cost of generation.
Why? Well because it would be funny. OK, maybe not funny - but it would help explain why a business that wants to drive down the pricing of its product isn’t a great business. In addition, it might provide some insight into what a real cost fo generation is (hint: it is definitely above the market price on days with lots of wind and sun).
Margin Call
Let’s ignore periods of negative pricing for the moment, but just think about a scenario in which most of the electricity is being generated by wind and solar and that it is sold at the market price (which is often mistaken for the marginal cost of generation). Because of the current pricing system, this rarely happens - but let’s do a thought experiment: imagine what would happen if our erstwhile bloggers got their wish.
Ørsted is a public company with significant operations in the UK, dominated by offshore wind - I will use it as an example because of the publicly available information and the scale of its business - this is not intended as a critique of Ørsted, but as an illustration of the problematic thesis that “lower prices would be a good thing”.
The Ørsted business model is complex mixing generation (and sales of electricity) with a service business building wind farms, as well as legacy biomas and gas (mostly not in the UK). However, by focusing on the UK part of their operations we can start to build a picture from public accounts/information. Disclaimer - the following is based on AI research - I don’t have the time/skills to do this organically.
To calculate the average price Ørsted received for the electricity it sold in the UK in 2023, we’ll can use the data from the 2023 Annual Report and combine it with an estimate of the electricity sold. The 2023 Annual Report provides specific revenue figures, and we can derive a reasonable estimate for UK electricity sales based on capacity and operational data.
Key Data for 2023
UK Revenue in 2023: According to Ørsted’s 2023 Annual Report, the company generated DKK 45.8 billion in revenue from the UK.
Electricity Sold in the UK in 2023: Ørsted doesn’t explicitly state the exact TWh sold in the UK in the 2023 report, but we can estimate it based on installed capacity and operational performance:
Installed Capacity: By the end of 2023, Ørsted’s UK offshore wind capacity was approximately 5.6 GW, including Hornsea 1 (1.2 GW), Hornsea 2 (1.3 GW, fully operational by late 2022), and other farms like Walney, Burbo Bank, and Race Bank totaling the rest.
Capacity Factor: UK offshore wind farms typically achieve a 40-50% capacity factor. Ørsted’s 2023 report notes strong performance with Hornsea 2 ramping up, so let’s use 45% (consistent with 2024 assumptions and industry norms).
Annual Generation: For 5.6 GW over 8,760 hours gives 22 TWh
Sales Efficiency: Assuming 98% of generation is sold (accounting for minor losses), as in 2024 we get 21.5 TWh
Cross-Check: Ørsted’s 2023 report states offshore sites globally generated DKK 20.2 billion in EBITDA, with the UK as a major contributor (Hornsea 2 doubled earnings). Total group’s global generation was ~35-38 TWh (implied from prior years and renewable share), and the UK’s 5.6 GW of ~10 GW offshore capacity suggests ~20-22 TWh, aligning with 21.5 TWh.
Step 2: Calculate Average Price
Revenue in DKK: DKK 45.8 billion (confirmed from the 2023 Annual Report).
Volume Sold: 21.64 TWh = 21,640,000 MWh.
Average Price in DKK/MWh: 2,116 DKK/MWh
Convert to £/MWh (1 DKK ≈ £0.115 in early 2023): approx. £243/MWh
Step 3: Contextual Check
UK Market Prices: In 2023, UK wholesale electricity prices averaged £100-120/MWh (DESNZ), but Ørsted’s revenue includes Contracts for Difference (CfDs) strike prices (e.g., £150-200/MWh for Hornsea 1, adjusted for inflation to ~£180-220/MWh in 2023 terms) and PPAs, which elevate the effective price. The £243/MWh estimate fits this premium structure, albeit looking a bit on the high side.
EBITDA Alignment: UK offshore wind contributed significantly to the DKK 20.2 billion offshore EBITDA. If UK generation was 21.6 TWh of the global ~35 TWh offshore output, the revenue per MWh supports a higher-than-wholesale price, consistent with CfD top-ups (£100-150/MWh above market rates).
Final Answer
From these calculations, Ørsted received an average price of approximately £243 per MWh (or DKK 2,116 per MWh) for the electricity it sold in the UK in 2023. This is based on DKK 45.8 billion in UK revenue from the 2023 Annual Report and an estimated 21.64 TWh sold, derived from 5.6 GW capacity at a 45% capacity factor. The revenues appear to reflect Ørsted’s reliance on CfDs and PPAs, exceeding wholesale averages, and includes minor non-generation revenue (e.g., storage, development). For the full report, see orsted.com/en/investors.
==> Ørsted appears to have received £243/MWh which is significantly above the estimated UK wholesale electricity price which averaged £100-120/MWh in 2023.
So what would happen if Ørsted was exposed to the lower sales prices that renewables advocates so want to see consumers benefitting from? Let’s use the 2023 average price.
On “top line” revenues we can compare the pro-forma financials under the hypothesis that Orsted receives the UK average (NOTE: this is not the “cheap wind and solar” that is proposed, just a less subsidised version of the actual situation).
Revenue Lost: Ørsted would have DKK 23.2 billion to DKK 27.0 billion (£2.66 billion to £3.10 billion) less revenue if it received £100-120/MWh instead of £243/MWh for its 21.64 TWh sold in the UK in 2023.
How this affects the profitability of any company depends a lot on how much of the revenue loss flows through to the bottom line, which hinges on the company’s cost structure. For this example, an approximation is:
Profit Decline: DKK 19.7-22.9 billion hit EBITDA, reducing:
Adjusted Net Profit (DKK 14.9 billion) to a loss of DKK 4.8-8.0 billion, showing the underlying business flipping to negative without CfD premiums.
Net Loss (DKK -20.2 billion) worsening to DKK -39.9 to -43.1 billion, amplifying the reported loss with impairments still included.
(NB: the “Adjusted Net profit/loss” is a calculated metric akin to operations and the “Net Loss” is a reported figure that includes one-off impairments due to cancelled projects and other adjustments)
Lower Prices Are Bad For Business - Who Knew?
So a significant reduction in the sales price of electricity (from £243 to c.£100/MWh) would have flipped the company from profit to loss in 2023.
Now take that logic further - what if the price wasn’t £100-£120/MWh, but closer to the near-zero aspirational cost of lots of wind and solar? Without doing the math it should be clear that prices of say £44/MWh2 would be catastrophic for a company such as Orsted3. If we were to do away with CfDs and PPAs and allow the renewable electricty generators to be paid something close to their supposed marginal price there would be a double (negative) whammy effect. Due to the correlation of generation wind and solar (in a country like the UK with high penetration) market-prices would deliver low prices when generation volumes are high and high prices when generation is low. The average would be strongly weighted to the high-volume—low-price days.
I mean, seriously, what business aspires to provide a service at the lowest possible cost?
Even with guaranteed prices the renewables companies are struggling, as evidenced by their share-price declines. These are low margin businesses that even with strong subsidies (price supports) can’t handle 5% interest rates… You have to ask seriously about the underlying business case.
Maybe offshore wind farms will become the real “stranded assets” : the term that renewable advocates gleefully ascribe to oil and gas fields.
This simple formulation is complicated by other factors - generally even if 100% wind/solar is available some amount of gas, and nuclear stay on line because (1) nuclear especially can’t be ramped up and down, and even for gas and coal, ramping is not ideal, and (2) the system needs frequency stability and inertia control provided by them, not just capacity. The pricing system is more complicated than this, with time-ahead pricing bids and so on, but let us park those complexities and just think about what would happen if we could decouple the “cheap” wind from the “expensive” gas.
This was the CfD price for fixed-bottom offshore wind that attracted no bids in the UK’s AR5 round (note that it was £44 indexed to 2012 - so would be c. 20% higher in 2023/4 prices).
It is clear that CfD bid prices are a better indication of actual marginal costs than the market-clearing price. That said, CfD bid prices appear to be often understated as companies seek to grab market share.
I would argue the ‘real cost’ of renewables is really just the cost to the country as a whole.
In other words to make a valid comparison you would also have to include the costs of providing back-up for intermittency, the transmission system upgrades to cope with their inherent overcapacity, the tie-ins of all the new generation sites and the costs of providing ancillary services (the network stability functions provided by conventional generation). Currently since we have no direct government subsidies these costs are hidden in our bills and borne by consumers.
So in reality the costs of renewables are even higher than this analysis suggests and without the cushion of the various subsidies, ‘market mechanisms’ etc. simply not commercially viable.
The much quoted (I would say abused) LCOE was never intended for use when evaluating very different forms of generation. As any Electrical Engineer will tell you, in system terms renewables are very different … it’s not a ‘like for like comparison’ and so the metric is useless.
Dieter Helm the renowned economist has drawn a similar conclusion ie. for the UK renewables are far more expensive than most other forms of base load generation when you consider the total (system) costs.
Love this. Energy markets and marginal pricing aren't my deep expertise, although they matter and I am interested, I just end up focusing on technical matters more. I will try to read this, I know its important.
What I find really interesting about marginal pricing and costs, is the very nature of the Marginal Revolution, and its partly German language roots. For years I never understood the exact meaning of the word marginal, but it became clear when I learned its a translation from the German 'grenze' meaning border, so its the economics of things on the border, or 'on the margins'. THEN I got it.
To this day I still dont know what a fucking eigenvalue is.